精读,不要贪多,做好笔记,以及完成博客
阅读:
metrics
可以用来做程序的监控,就是如果程度内存的指标太高,就会警告,或者其他量化指标sa := make([]metrics.Sample,1) sa[0].Name = "/cpu/classes/gc/total:cpu-seconds" metrics.Read(sa) if sa[0].Value.Kind() == metrics.KindBad { panic("panic") } fmt.Printf("gc : %f \n",sa[0].Value.Float64())-
func main() {
    bufio.NewReader(os.Stdin).ReadBytes('\n')
    for range 20 {
        _ = make([]byte,4<<20)
        //fmt.Println("alloc",i)
    }

    // /cpu/classes/gc/total:cpu-seconds
    sa := make([]metrics.Sample,1)
    sa[0].Name = "/cpu/classes/gc/total:cpu-seconds"
    metrics.Read(sa)

    if sa[0].Value.Kind() == metrics.KindBad {
        panic("panic")
    }

    fmt.Printf("gc : %f \n",sa[0].Value.Float64())

    f,err := os.CreateTemp("/tmp","b")
    if err != nil {
        panic(err)
    }
    f.Close()
    fmt.Printf("f %s\n",f.Name())

    fmt.Printf("add cleanup\n")
    runtime.AddCleanup(f,func(name string) {
        fmt.Printf("\nclearup\n %s \n",name)
        os.Remove(name)
    },f.Name())


    fmt.Printf("gc\n")
    runtime.GC()
    fmt.Printf("gc over\n")
    time.Sleep(100 * time.Millisecond)

}
weak#Pointer
不增加对象引用计数
一旦目标被GC回收,指针就变Nil了runtime#SetFinalizer
建议用AddCleanUp给一个对象绑定一个最后执行的函数,在被GC回收时,这个函数会被执行
当GC检测到对象无引用时, 1. 清除对象与终结函数的关联 2. 在独立的goroutine中执行绑定的终结函数runtime.GC
runtime#GC
做垃圾回收,执行会阻塞整个进程,直到垃圾回收完成pprof#hdr-Profiling_a_Go_program
关联trace, 非常重要,用来看作为程序的性能调优依据
为pprof的可视图工具收集运行的数据
go tool pprof --help
GC
内存限制是一个强大的工具,但内存限制并没有代价,也不会使GOGC失效。
Latency
一般的GC,stop-the-world
gogc not fully stop-the-world,gogc是并发的。
减少GC频率用以优化延迟。
优秀参考
GC 参考阅读资料 gc-guide#Additional_resources
agent practice
基于gin写一个GC分析教程,让我通过访问哪些接口,看哪些GC数据,以掌握通过GC日志分析代码BUG
我已经定义好了
题解
2025-11-08 22:39:07 终于把Vnote有残影的问题通过Kimi2Turbo Thinking解决了。朋友们,不如直接花钱买Typora,如果乐意HappyHacking,那就是值得的。
pprof里面居然有trace,是我草率了
首先需要将net_pprof配置于程序中
import (
    _ "net/http/pprof"
)


// 空白引入pprof后,使用http直接Listten,就会将pprof注册到该服务中
func main() {
   go func() {
        log.Println(http.ListenAndServe("localhost:6060", nil))
   }()
}
使用 localhost:6060/debug/pprof,可查看具体链接
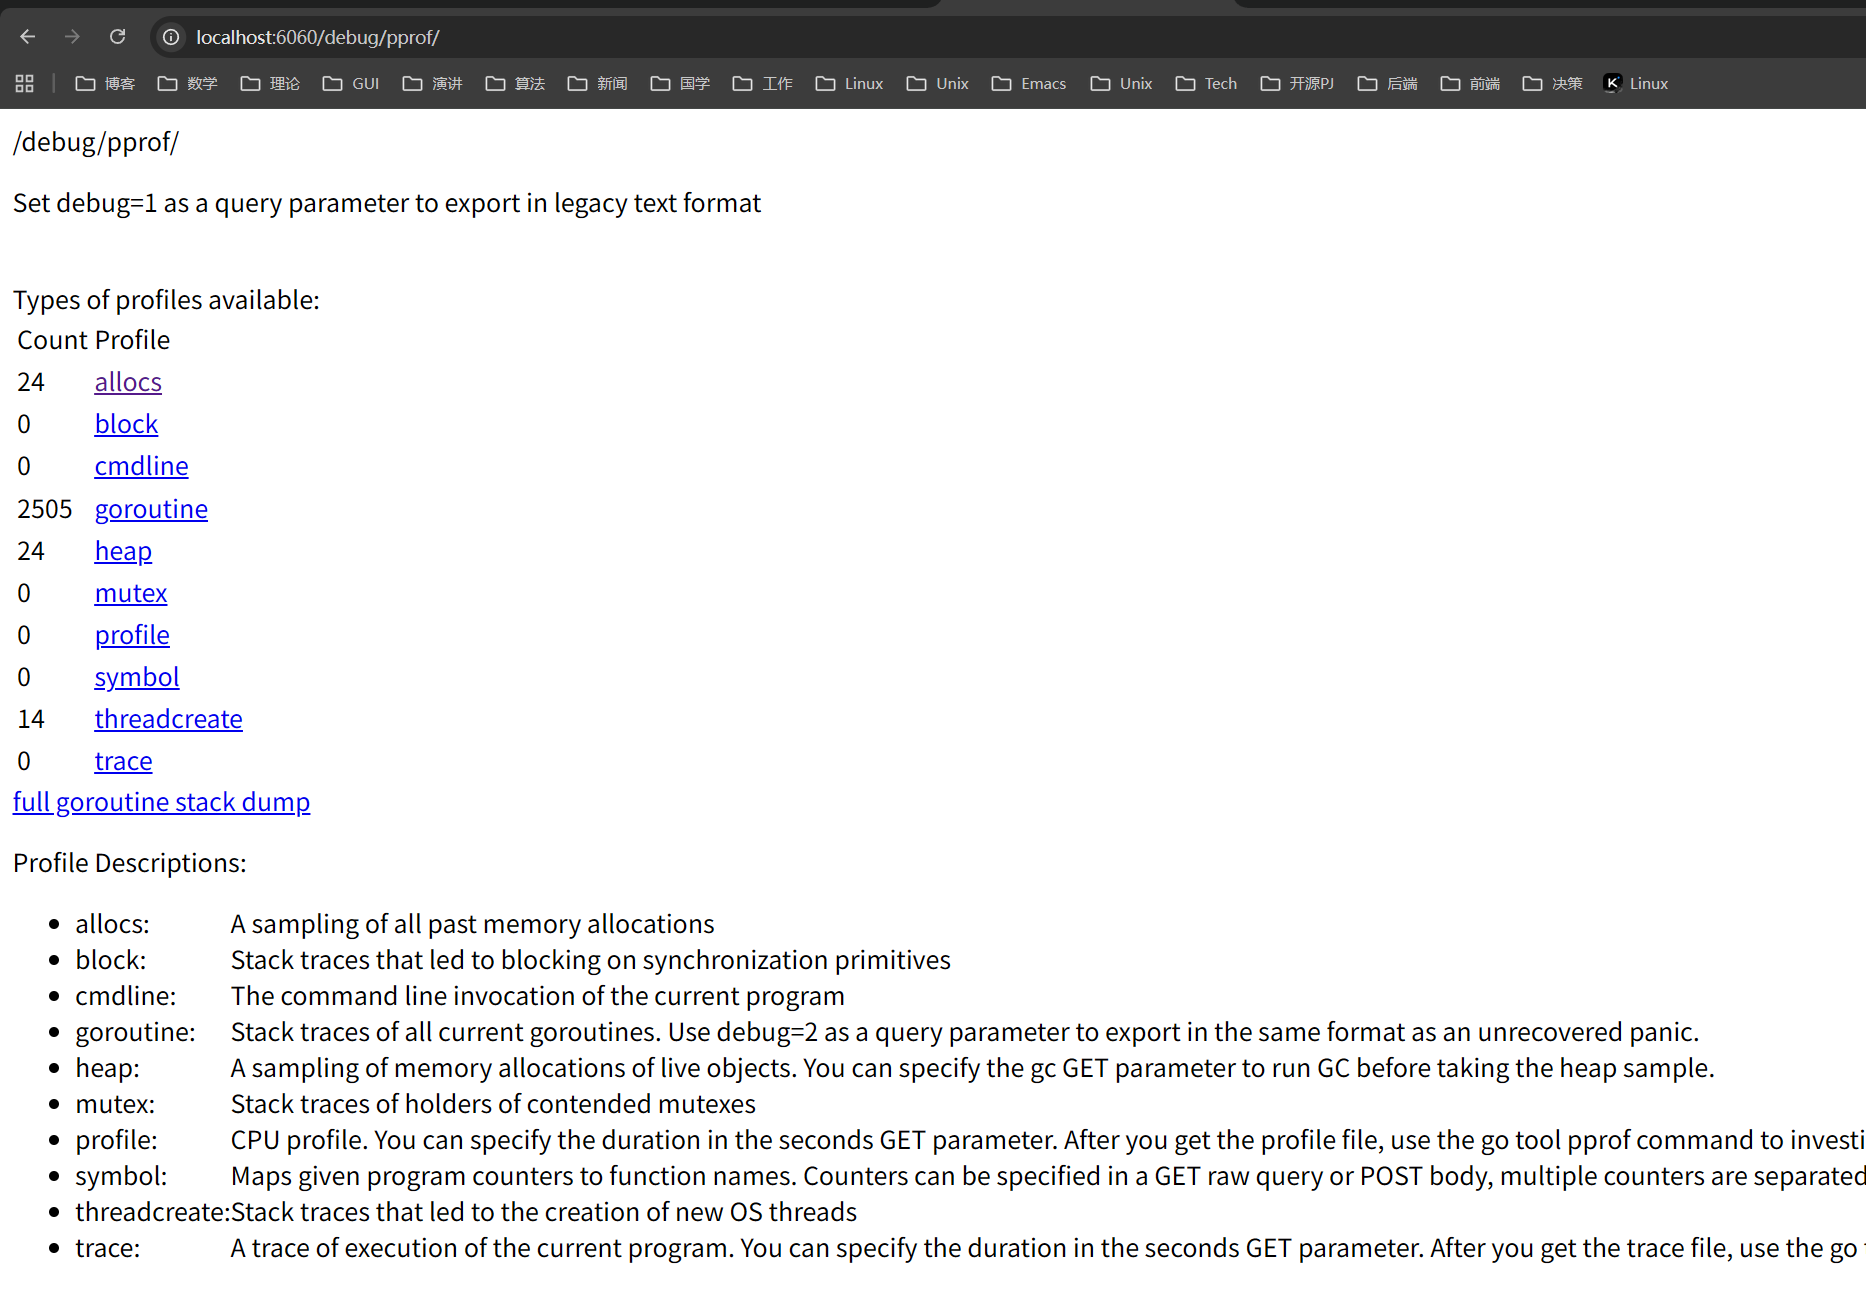
curl 对应的链接,导出
然后使用 go tool pprof --http=:<port> <profile>
curl http://localhost:6060/debug/pprof/heap > heap.profile
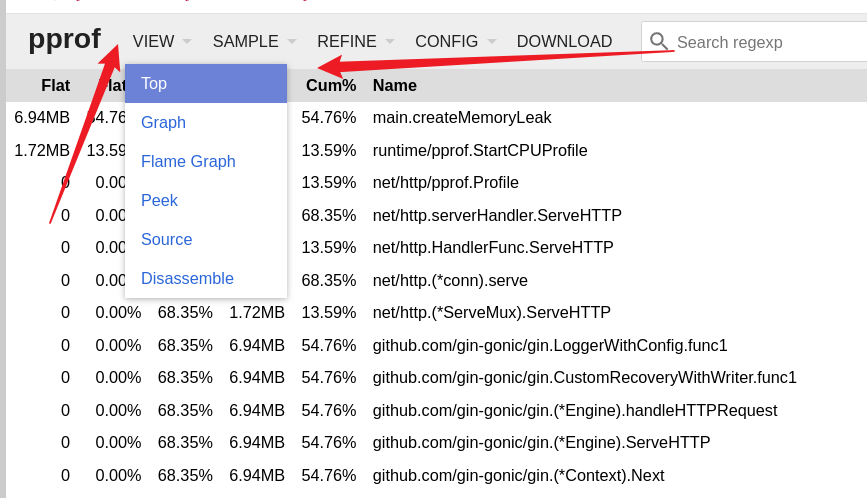
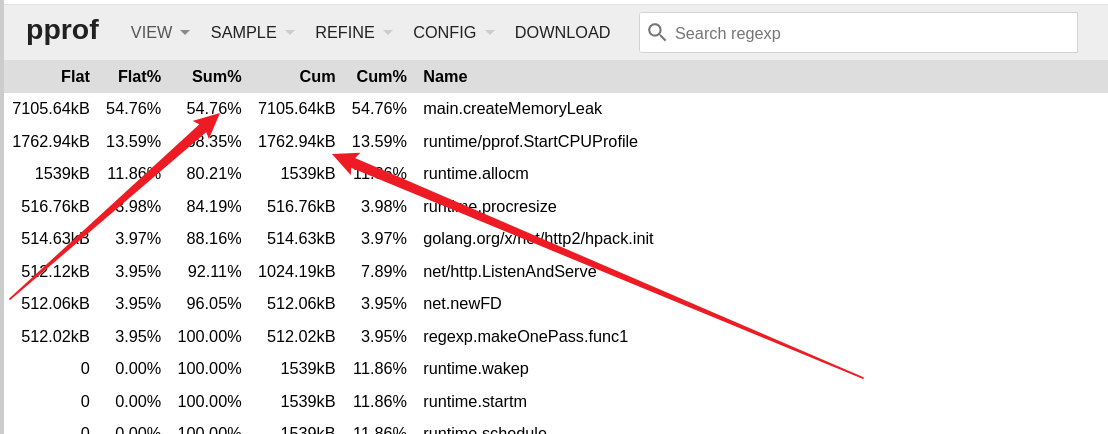
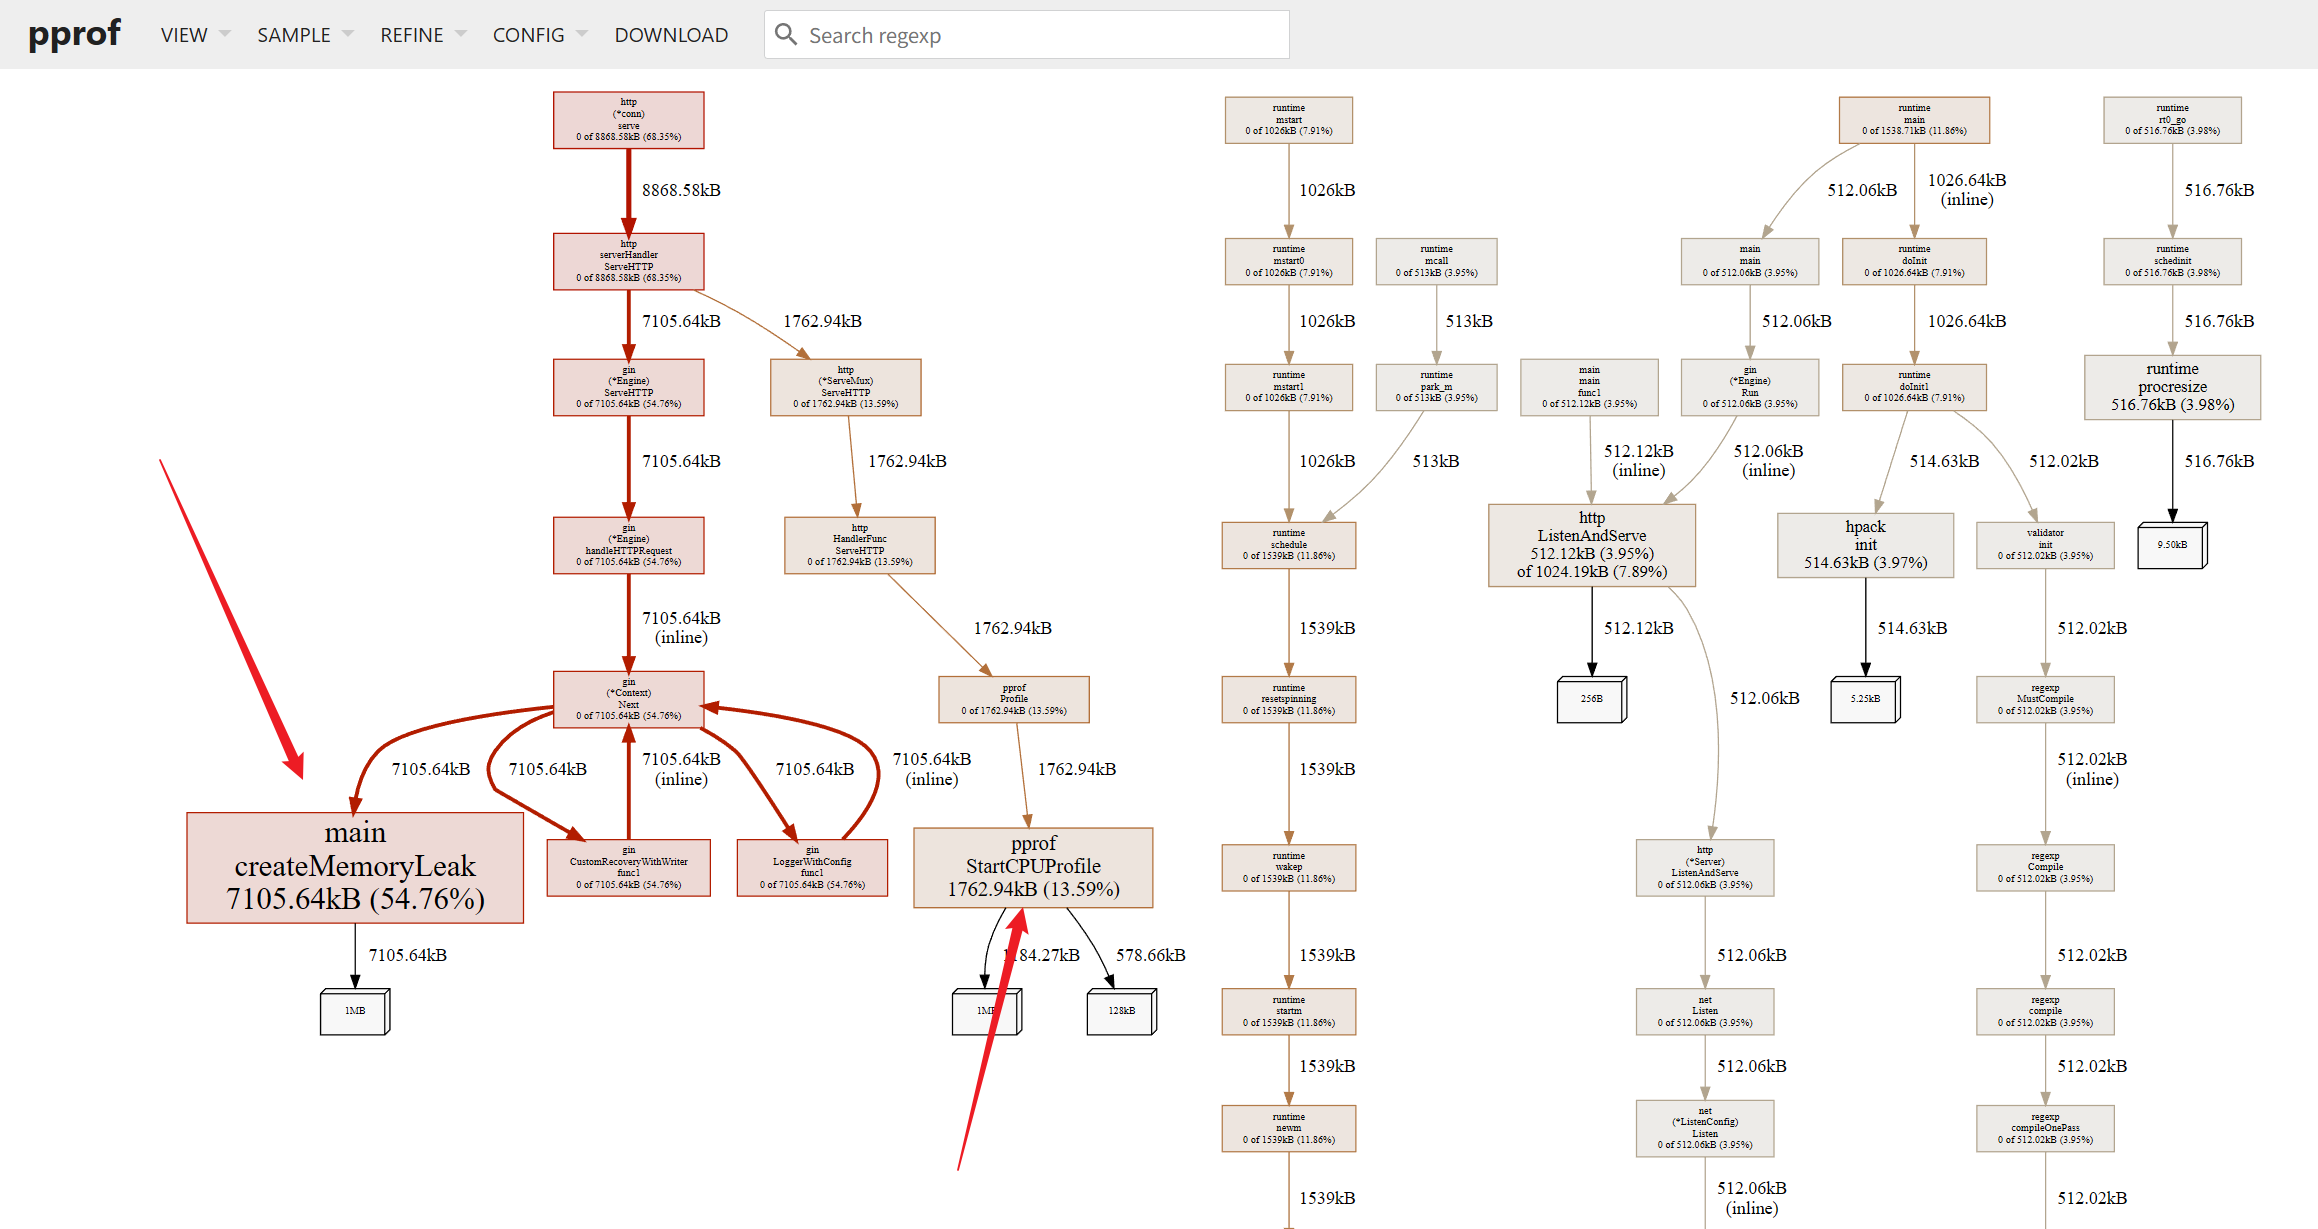
go tool pprof --http=:8083 ./heap.profile
通过图,一眼能看出来有问题的代码,泄漏内存。
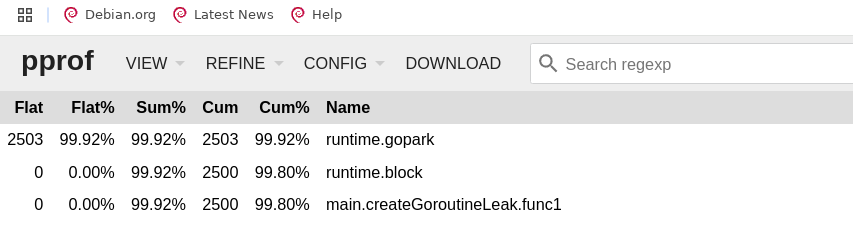
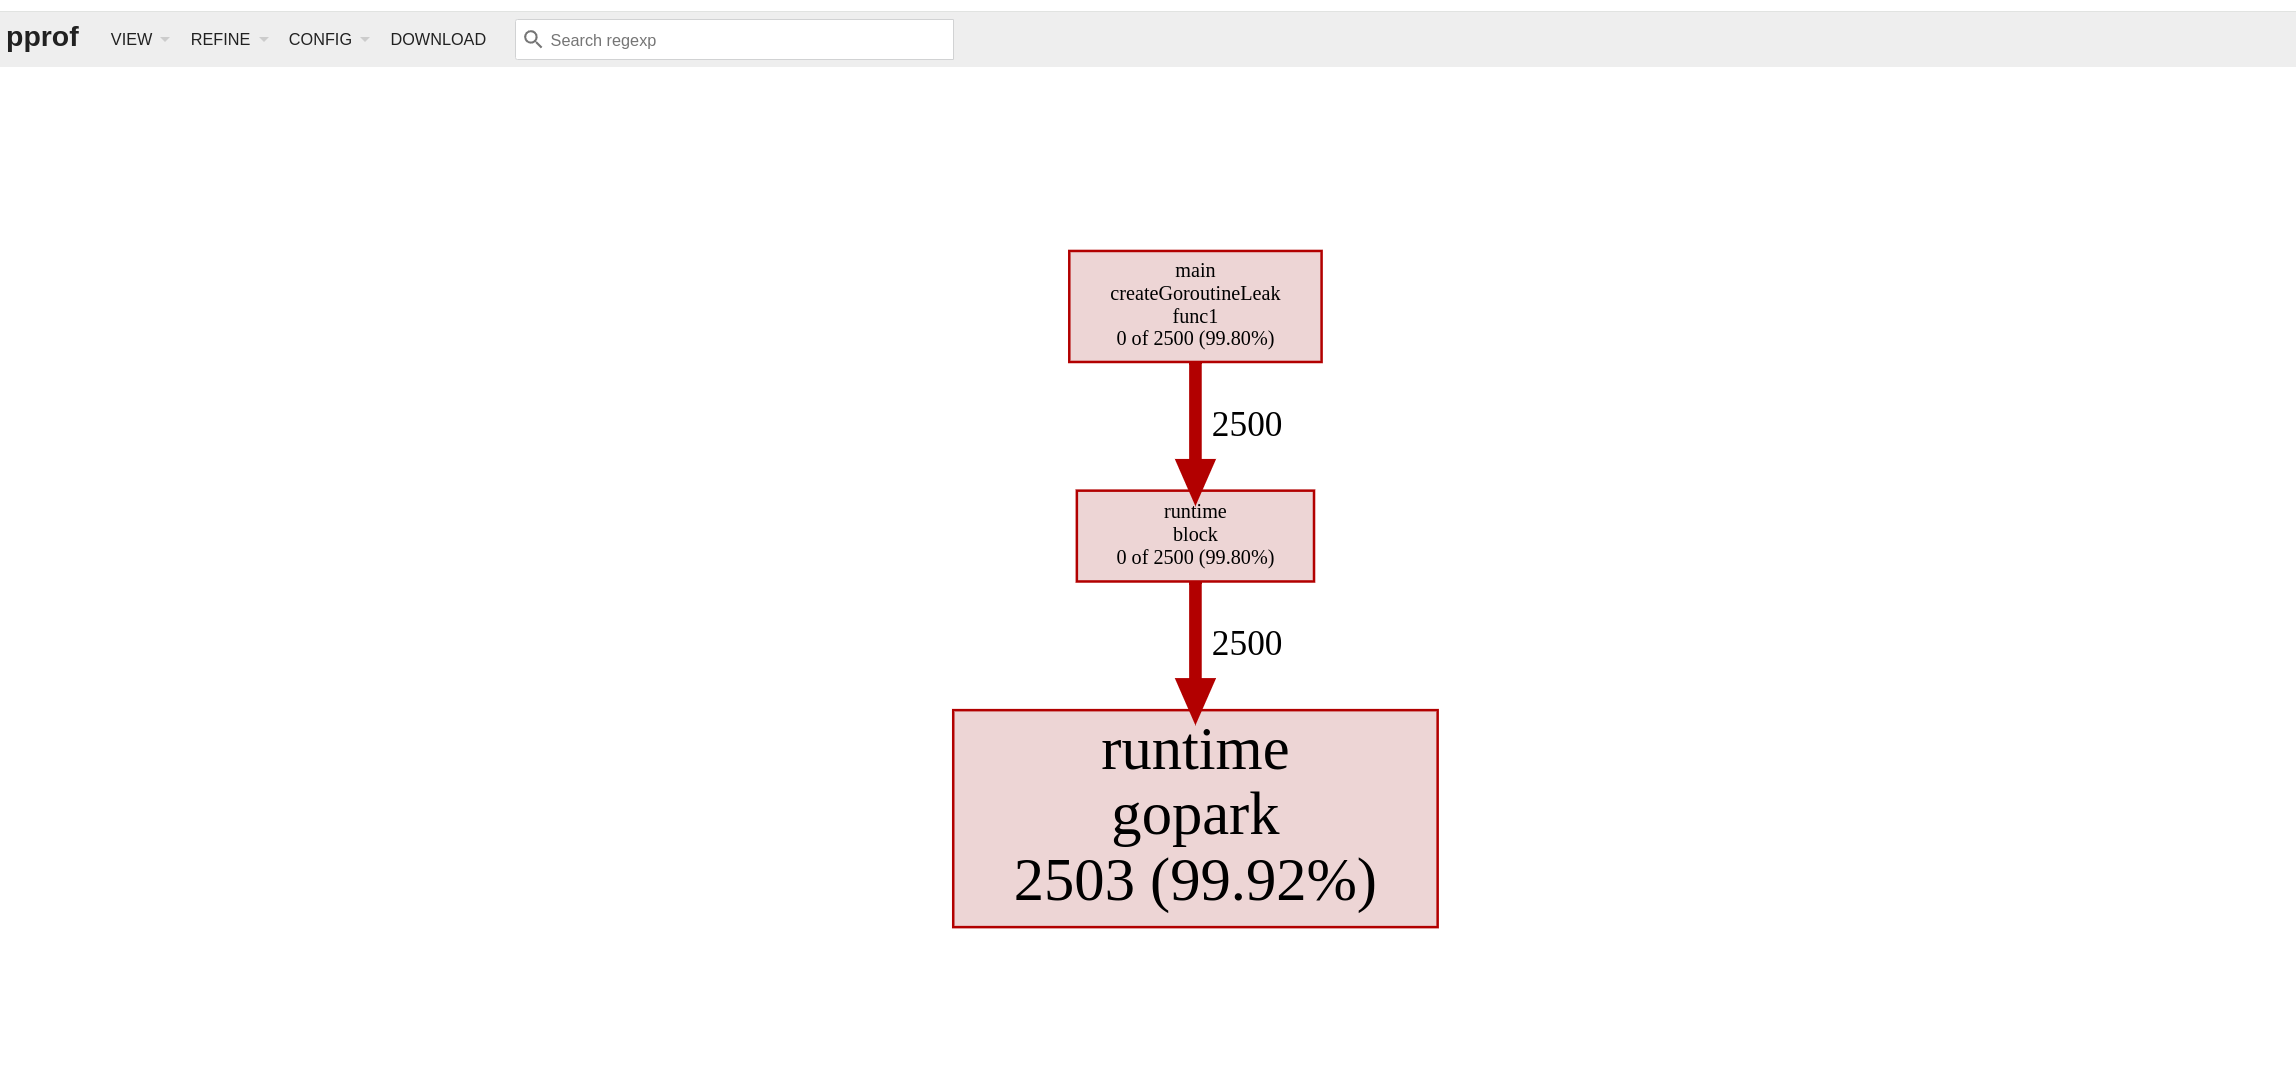
goroutine泄漏情况,一眼明了
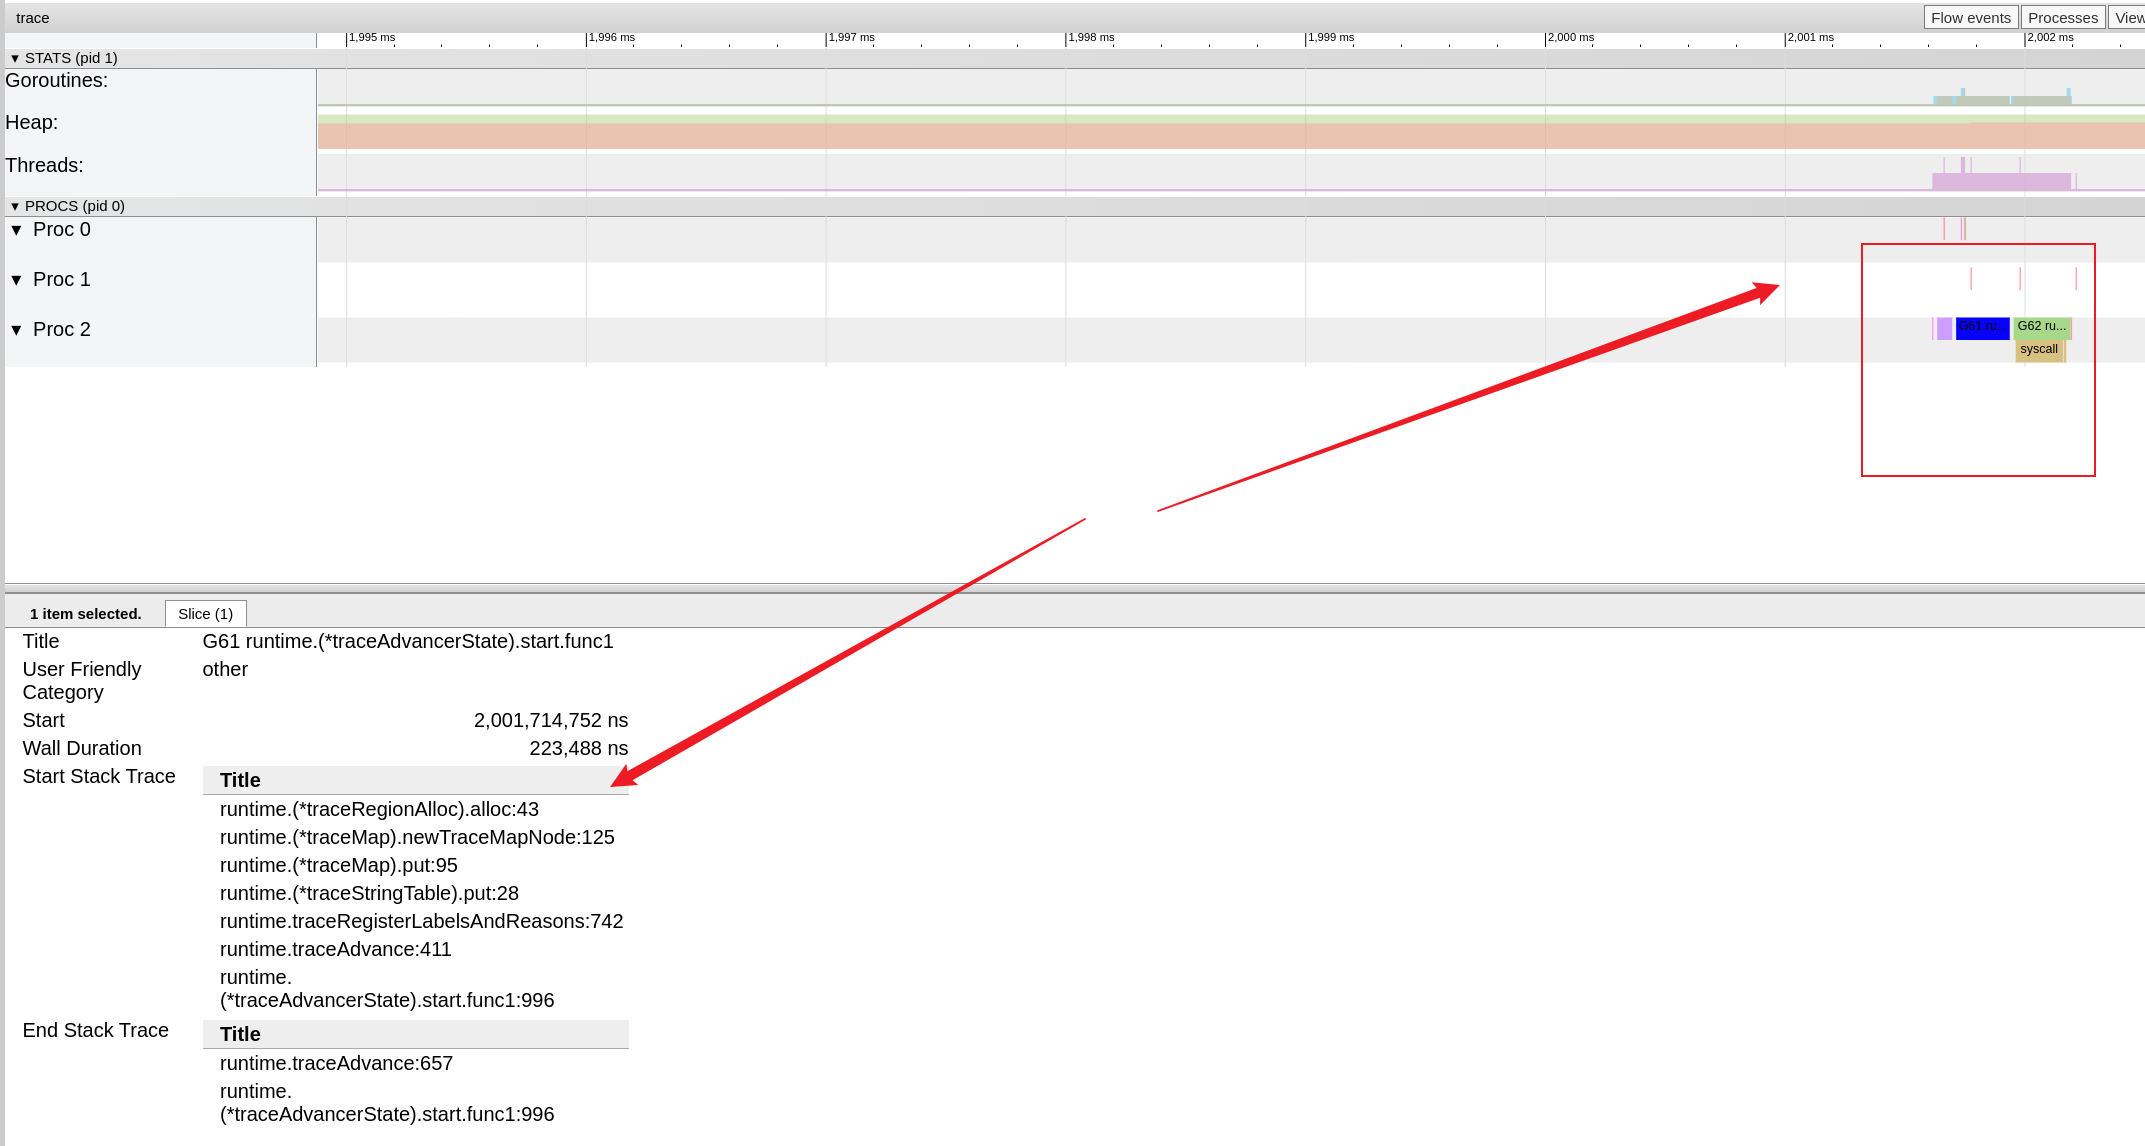
Trace
trace的情况特殊
curl http://localhost:6060/debug/pprof/trace?seconds=40 -O trace.out
需要使用go tool trace 来预览
go tool trace -http=:8084 ./trace.out
这真的很牛逼,2025-11-07日帮我在公司一眼定位到代码BUG。